Augur
Preface
IMPORTANT
Augur is an important tool for cell type prioritization in single-cell transcriptomics. It helps researchers identify the most sensitive cell types under specific perturbation conditions, providing important clues for understanding the response mechanisms underlying cellular heterogeneity.
In single-cell studies, we not only focus on cell classification and marker genes, but also hope to gain deeper insights into the response differences of cells under different conditions. Augur evaluates the sensitivity of different cell types to perturbations through machine learning algorithms, providing quantitative indicators for identifying key cell types.
Core Functions of Augur
- Cell Type Prioritization: Evaluates the sensitivity of different cell types to perturbations based on machine learning algorithms
- Perturbation Response Visualization: Maps cell type priorities to dimensionality reduction plots, intuitively displaying the spatial distribution of perturbation responses
- Quantitative Assessment Metrics: Quantifies the response intensity of different cell types to perturbations through AUC values
- Cross-Condition Comparison: Compares perturbation response differences of cell types under different experimental conditions
This document aims to provide single-cell researchers with a comprehensive Augur technical guide, covering its basic principles, operation methods on SeekSoulOnline, result interpretation, practical cases, and common questions, helping you quickly master and apply this tool.
Augur Theoretical Foundation
Core Principles
The core idea of Augur is: evaluating the response sensitivity of different cell types to perturbation conditions through machine learning algorithms, thereby prioritizing cell types. This process can be summarized into the following main steps:
- Data Preprocessing: Input single-cell RNA-seq data, select cell types and perturbation conditions to analyze
- Feature Selection: Build feature matrices based on gene expression data
- Machine Learning Modeling: Use classification algorithms (such as random forest or logistic regression) to train classifiers and predict cell perturbation states
- Performance Evaluation: Evaluate classifier performance through Area Under the Curve (AUC), where higher AUC values indicate greater sensitivity of the cell type to perturbations
- Prioritization: Sort cell types according to AUC values to identify the most sensitive cell types
Key Algorithm Details
1. Random Forest/Logistic Regression - Classification Algorithm
- Principle: Use random forest or logistic regression algorithms to predict cell perturbation states based on gene expression features
- Output: Classification performance (AUC value) for each cell type, reflecting its sensitivity to perturbations
2. AUC Evaluation - Model Performance Metric
- Principle: Area Under the Curve (AUC) is used to evaluate classifier performance
- Significance: Higher AUC values indicate greater response sensitivity of the cell type to perturbation conditions
- Output: AUC value for each cell type, used for subsequent analysis and visualization
Core Analysis Metrics
1. AUC (Area Under the Curve)
- Definition: Area under the receiver operating characteristic curve, a metric for measuring classifier performance
- Calculation: Based on the prediction accuracy of the classifier for perturbation states
- Application: Quantifies the sensitivity of different cell types to perturbations, with higher values indicating greater sensitivity
2. Prioritization (Rank)
- Definition: Sorting of cell types based on AUC values
- Calculation: Sort cell types from high to low according to AUC values
- Application: Identify cell types most sensitive to perturbations
SeekSoulOnline Operation Guide
On SeekSoulOnline, the Augur analysis workflow is designed to be intuitive and easy to use. You don't need to write code, just complete the analysis through the parameter configuration interface.

Preparation Before Analysis
IMPORTANT
The success of Augur analysis largely depends on the quality of input data and the reasonableness of perturbation conditions. Before starting the analysis, please ensure:
- Data has been preprocessed: Your single-cell data has undergone standard quality control, dimensionality reduction, clustering, and cell type annotation.
- Perturbation conditions are clear: Clearly define the perturbation conditions to compare (such as disease vs healthy, treatment vs control, etc.).
- Appropriate cell subpopulations are selected: Augur analysis should be performed in biologically meaningful cell subpopulations, such as annotated cell types.
Parameter Details
The following table details the main parameters and their descriptions of the SeekSoulOnline Augur analysis module.
| Interface Parameter | Description |
|---|---|
| Task Name | Name of this analysis task, must start with English letters. |
| Group.by | Select the label corresponding to the cell type or cluster to analyze, such as celltype. |
| Cell Type | Select specific cell types or clusters to analyze. |
| Perturbation Factor | Column name in the meta.data of the Seurat object for grouping information, used to define perturbation conditions. |
| Perturbation target | Grouping names of the perturbation factor for analysis, at least two must be selected. |
| Downsample | Whether to randomly downsample large datasets, default is False. |
| Downsample_num | Number of cells retained after downsampling for each cell subpopulation, default is 1000. |
| Note | Custom note information. |
Important Notes
CAUTION
- Large Dataset Processing: When the total number of cells is large, if the
Downsampleparameter is set toFalse, the analysis may fail due to insufficient memory. It is recommended to set this parameter reasonably according to data scale. - Metadata Standards: Please ensure that metadata column names and content in RDS files do not contain Chinese characters or special characters (such as
&), otherwise it may cause workflow errors. - Perturbation Factor Selection: Ensure that the selected perturbation factor exists in the metadata and contains at least two different groups.
Operation Workflow
- Enter Analysis Module: Navigate to the "Advanced Analysis" module on SeekSoulOnline and select "Augur".
- Create New Task: Name your analysis task and select the samples or projects to analyze.
- Configure Parameters: According to the above guide, select cell types, perturbation factors, and perturbation objects to analyze.
- Submit Task: After confirming that parameters are correct, click the "Submit" button and wait for the analysis to complete.
- Download and View: After the analysis is complete, download and view the generated analysis reports and result files in the task list.
Result Interpretation
Augur's analysis report contains rich charts and data files. The following is a detailed interpretation of the core results.
Visualization Chart Interpretation
AUC Dimensionality Reduction Plot
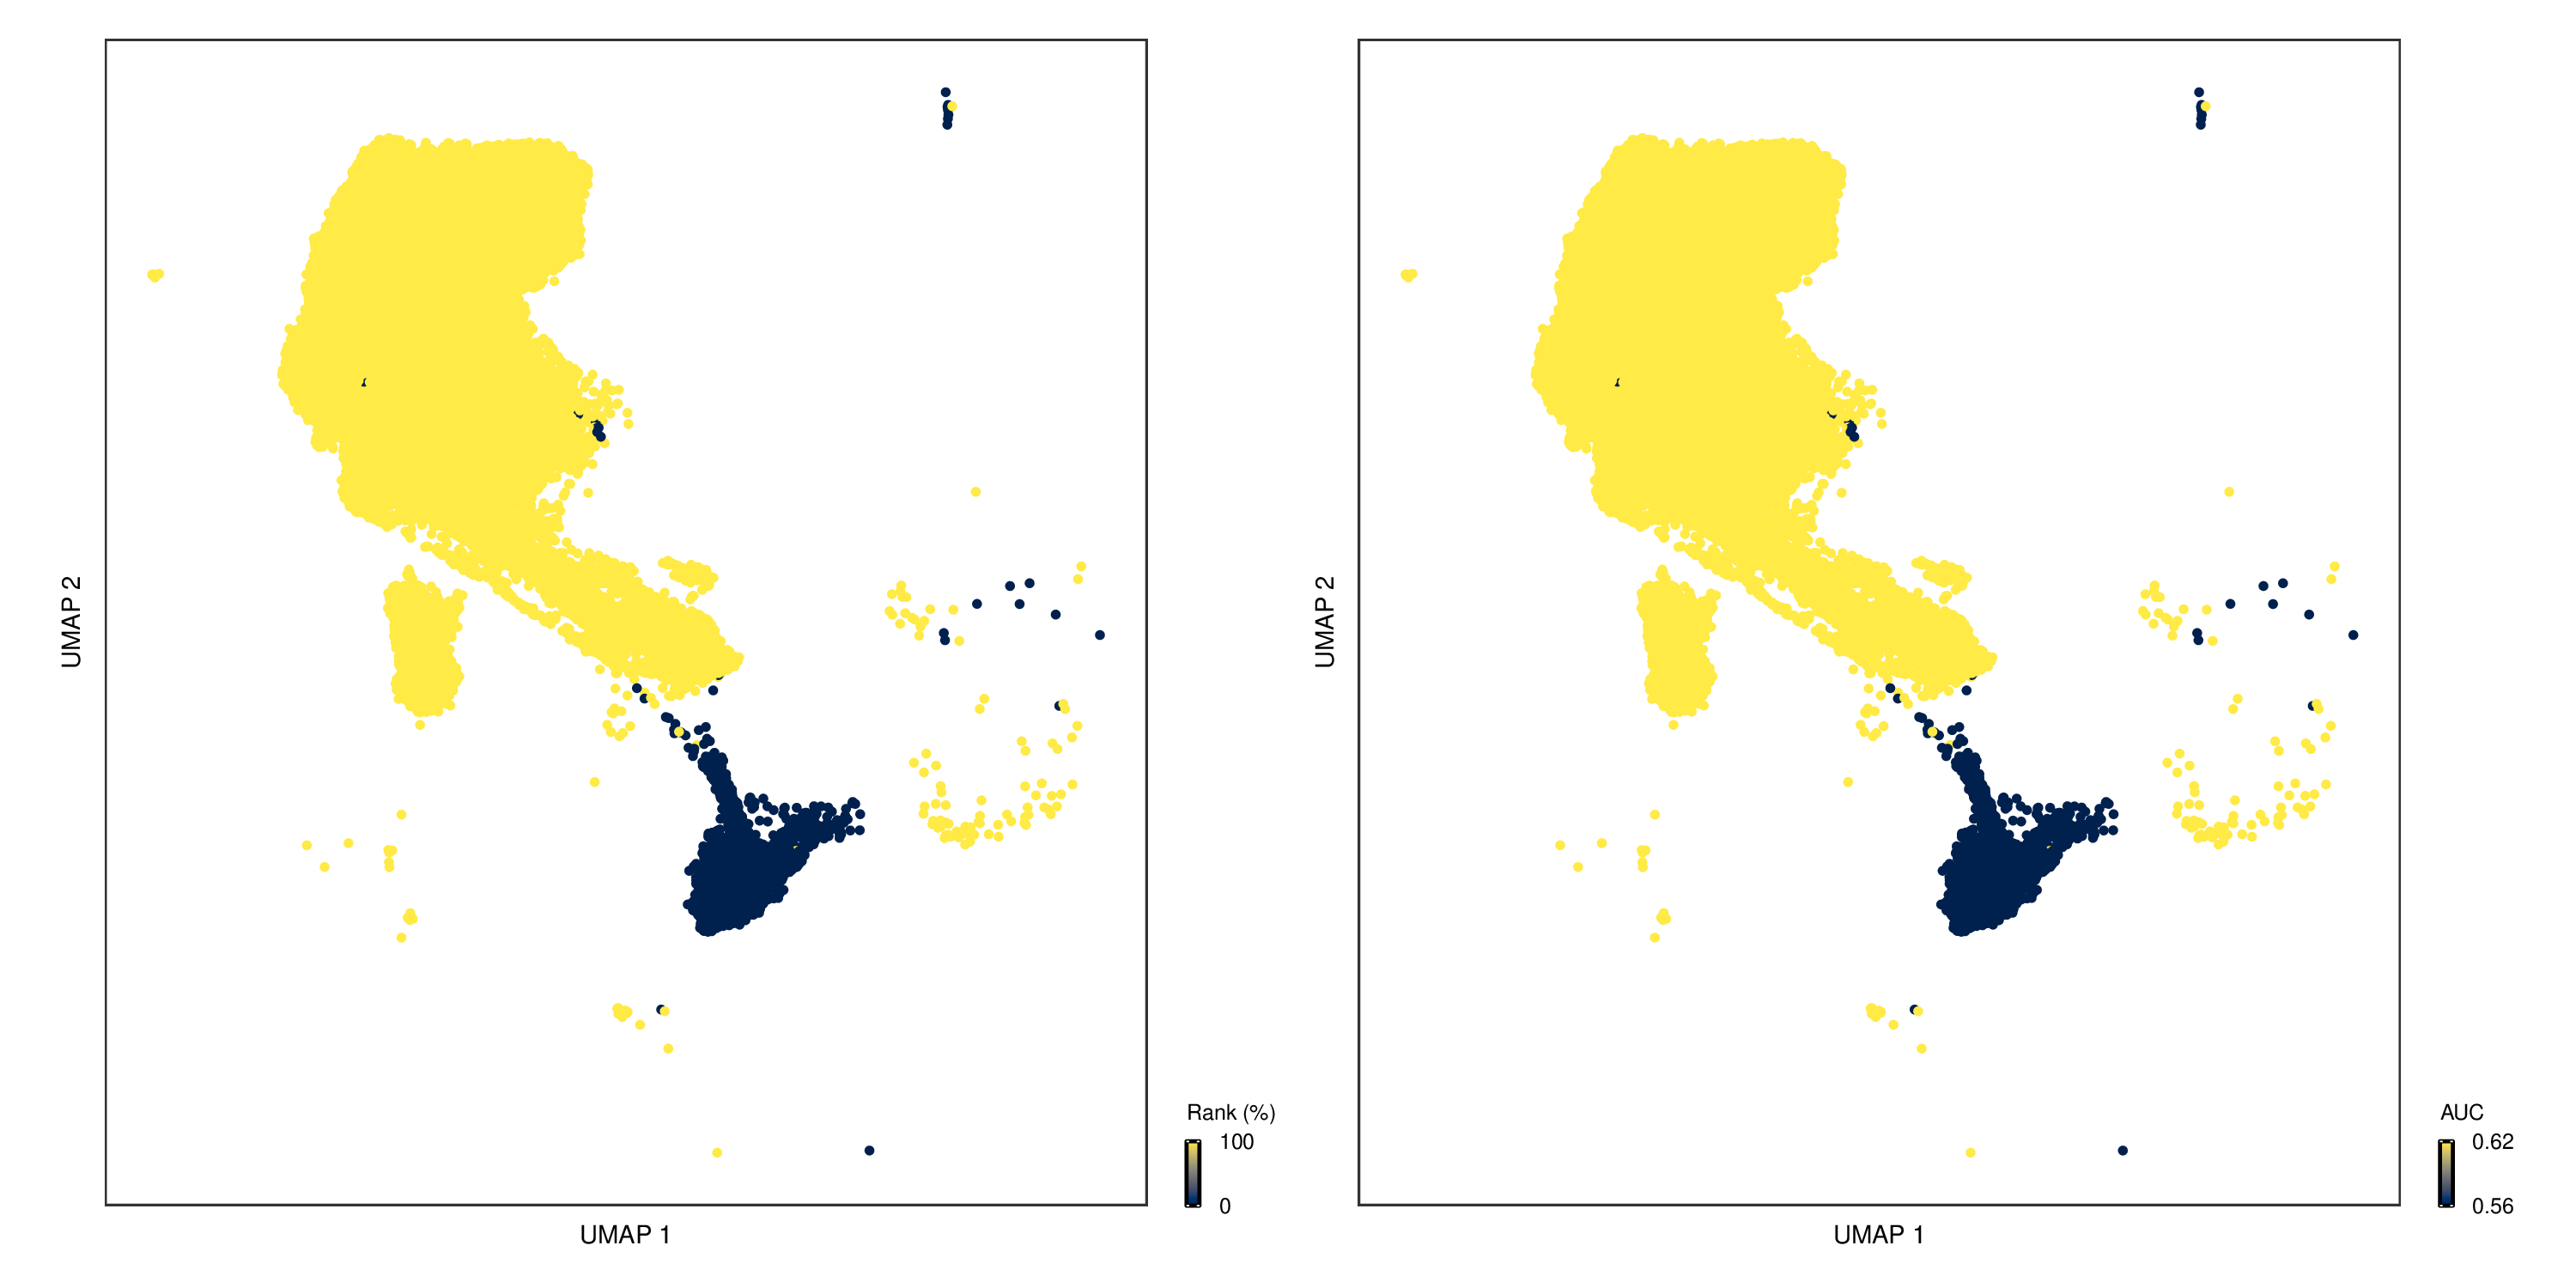
- Chart Interpretation: Displays the response sensitivity of different cell types to perturbations on UMAP/tSNE plots.
- Color Meaning: Yellow indicates high AUC values (sensitive to perturbations), blue indicates low AUC values (insensitive to perturbations).
- Left-Right Plot Comparison:
- Left plot: Colored based on relative ranking of AUC values
- Right plot: Colored based on original AUC values
AUC Lollipop Plot
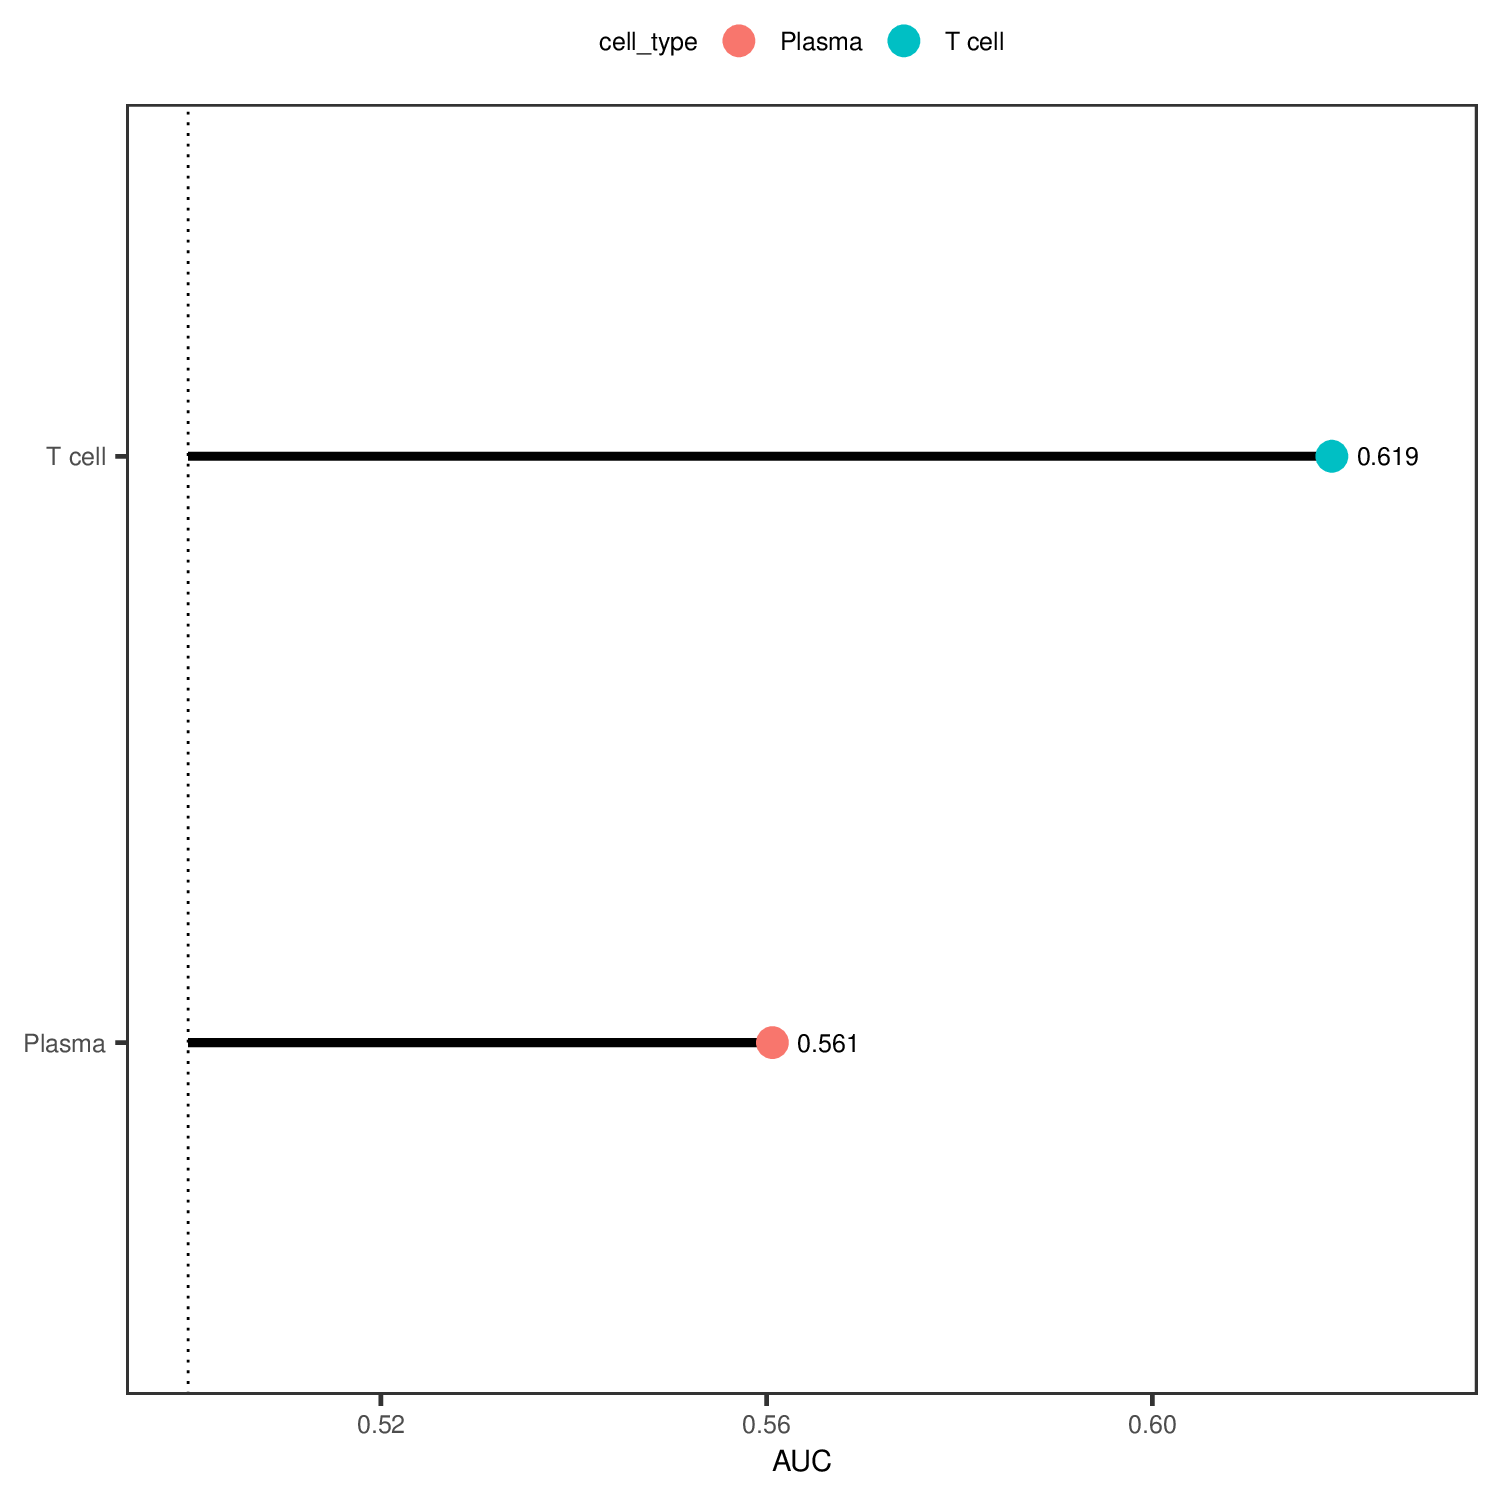
- Chart Interpretation: Displays AUC values of each cell type for comparing the sensitivity of different cell types to perturbations.
- X-axis: AUC value
- Y-axis: Cell type
- Color Meaning: Different colors represent different cell types
AUC Box Plot
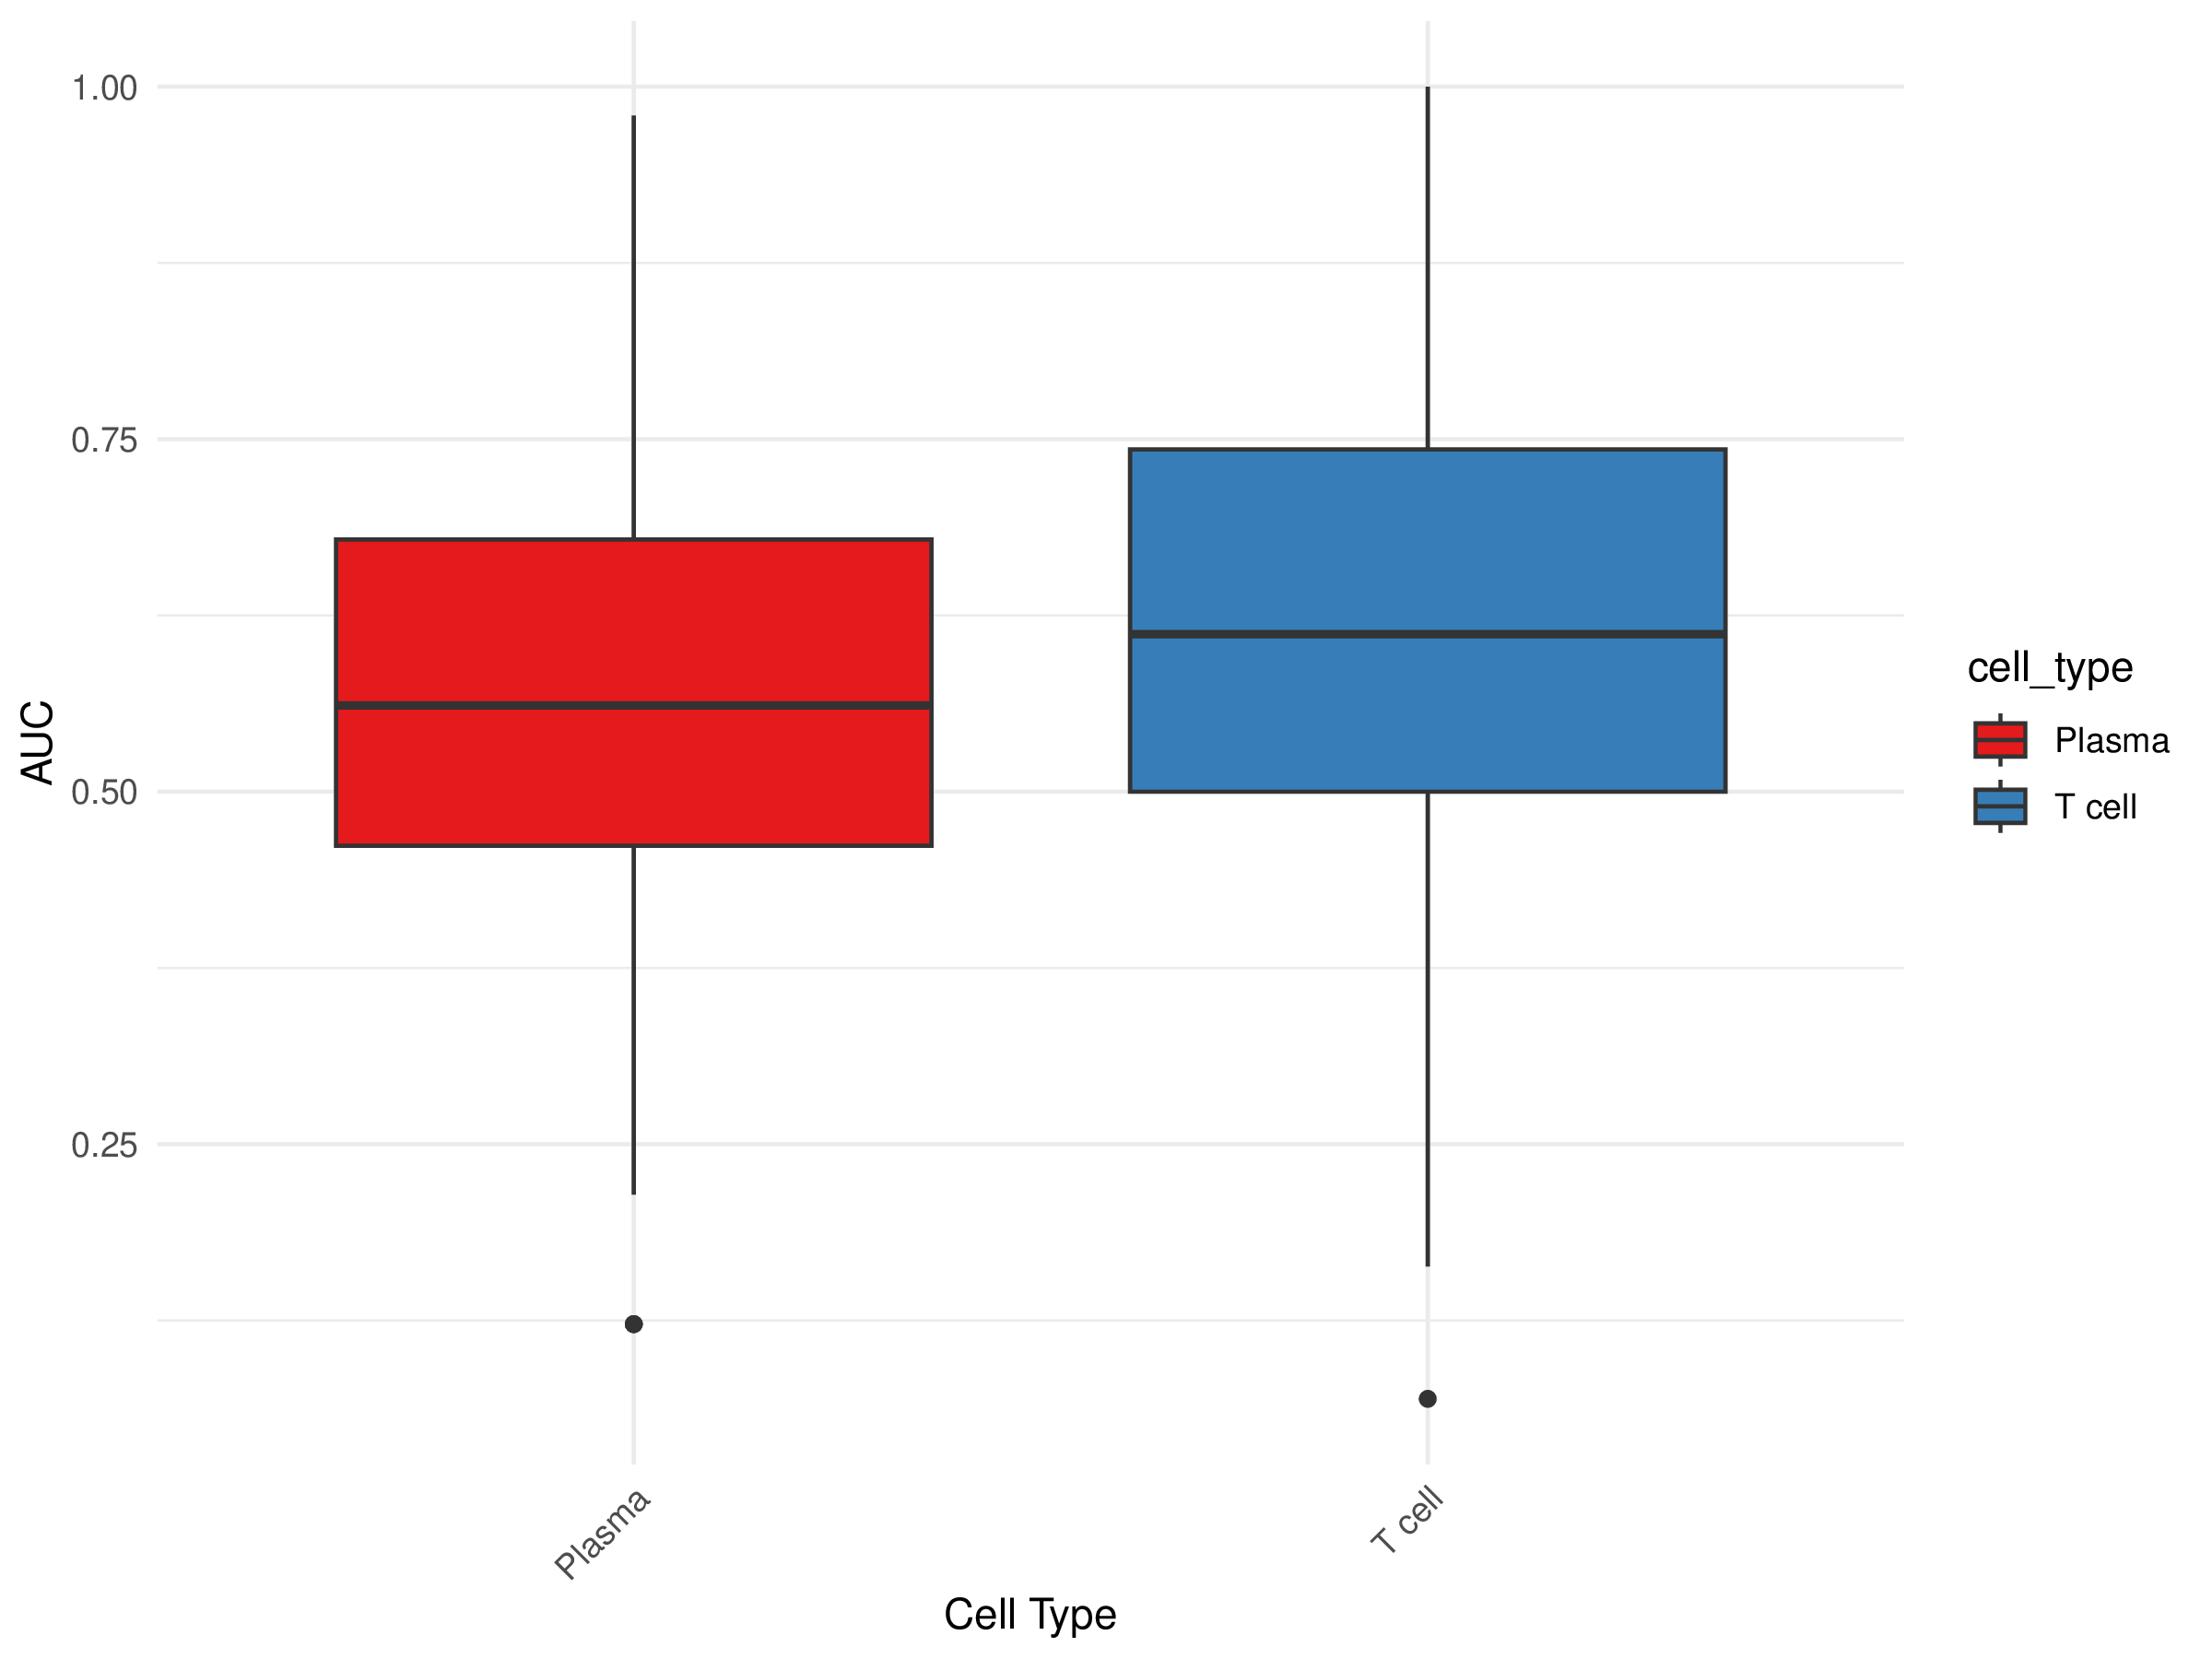
- Chart Interpretation: Displays the distribution of AUC values for each cell type.
- X-axis: Cell type
- Y-axis: AUC value
- Color Meaning: Different colors represent different cell types
Application Cases
Case 1: Identification of Key Neurons in Walking Function Recovery After Spinal Cord Injury
- Literature: Kathe C, Skinnider MA, Hutson TH, et al. Nature. 2022.
- Background: The goal is to identify neuron types that play key roles in the process of walking function recovery after spinal cord injury.
- Analysis Strategy: Used Augur analysis method to analyze 82,093 cell nucleus transcriptome data under 8 experimental conditions, prioritizing different cell types.
- Core Findings:
- Successfully identified that the excitatory spinal interneuronal population expressing Vsx2 and Hoxa10 (SC_Vsx2::Hoxa10) has the highest AUC value in epidural electrical stimulation rehabilitation therapy.
- Functional validation experiments confirmed that these neurons play an indispensable role in the process of walking function recovery.
- This study demonstrates the advantages of Augur in identifying key cell types in complex biological processes.
Case 2: Perturbation Response Analysis of Immune Cells in Disease States
- Background: Study the differences in response sensitivity of various immune cells under different disease states.
- Analysis Strategy: Collected single-cell RNA-seq data from disease groups and healthy control groups, ran Augur analysis to compare the response sensitivity of different immune cell subpopulations to disease states.
- Core Findings:
- Identified immune cell types most sensitive to disease states (such as certain T cell subpopulations or macrophage subpopulations).
- These cell types with high AUC values may serve as potential therapeutic targets or biomarkers.
- Combined with functional annotation analysis, revealed the molecular mechanisms of key cell types in disease progression.
Notes and Best Practices
TIP
Avoid Overinterpretation: Augur results are computational inferences based on transcriptome data. The level of AUC values does not directly equate to biological importance. Any key findings require subsequent biological experiments to confirm.
Frequently Asked Questions (FAQ)
Q1: How long does Augur analysis take?
A: Analysis time depends on data scale and computational resource configuration. Generally:
- Small datasets (1,000-5,000 cells): 30 minutes - 1 hour
- Medium datasets (5,000-20,000 cells): 1-3 hours
- Large datasets (>20,000 cells): 3-8 hours or longer It is recommended to set the Downsample parameter reasonably according to data scale to speed up analysis.
Q2: How to select appropriate cell types for analysis?
A: When selecting cell types, consider the following factors:
- Biological Significance: Select cell types that are functionally relevant or of interest in the research context
- Data Quality: Ensure that selected cell types have sufficient cell numbers (recommended >100 cells)
- Research Purpose: Select cell types of interest according to specific research questions
Q3: What is the significance of AUC values?
A:
- AUC (Area Under the Curve): Area under the receiver operating characteristic curve, used to evaluate classifier performance. In Augur, AUC values reflect the response sensitivity of cell types to perturbation conditions.
- AUC Interpretation: AUC values range from 0.5-1.0, where 0.5 represents random guessing level and 1.0 represents perfect classification. Generally, AUC>0.7 is considered to have good classification performance.
Q4: How to verify the reliability of Augur analysis results?
A: Result reliability can be verified through the following methods:
- Biological Validation: Validate the functions of key cell types by combining known literature and databases
- Experimental Validation: Verify the roles of key cell types through functional experiments (such as cell function inhibition/activation experiments)
- Cross-Validation: Verify result consistency using different datasets or analysis methods
Q5: What are the differences between Augur and other cell type analysis tools?
A:
- Augur: Focuses on evaluating the response sensitivity of cell types to perturbation conditions, prioritizing through machine learning algorithms
- SCENIC: Focuses on gene regulatory network inference and transcription factor activity analysis
- CytoTRACE: Focuses on cell differentiation trajectory inference and stem cell identification
- Monocle: Focuses on pseudotime analysis and developmental trajectory construction
Augur Official Repository: https://github.com/neurorestore/Augur
References
Skinnider MA, Squair JW, Kathe C, Anderson MA, Gautier M, Matson KJE, Milano M, Hutson TH, Barraud Q, Phillips AA, Foster LJ, La Manno G, Levine AJ, Courtine G. Cell type prioritization in single-cell data. Nat Biotechnol. 2021 Jan;39(1):30-34. doi: 10.1038/s41587-020-0605-1. Epub 2020 Jul 20. PMID: 32690972; PMCID: PMC7610525.
Kathe C, Skinnider MA, Hutson TH, Regazzi N, Gautier M, Demesmaeker R, Komi S, Ceto S, James ND, Cho N, Baud L, Galan K, Matson KJE, Rowald A, Kim K, Wang R, Minassian K, Prior JO, Asboth L, Barraud Q, Lacour SP, Levine AJ, Wagner F, Bloch J, Squair JW, Courtine G. The neurons that restore walking after paralysis. Nature. 2022 Nov;611(7936):540-547. doi: 10.1038/s41586-022-05385-7. Epub 2022 Nov 9. PMID: 36352232; PMCID: PMC9668750.